

The short version
- Connect Claude to Meta Ads and you can ask questions in plain English instead of digging through the dashboard.
- Best uses: spotting creative fatigue early, comparing audiences and writing briefs from real performance data.
- Setup takes minutes. Start with a weekly review asking what changed and why.
Meta Ads Manager gives you a lot of data. Impressions, CPM, CTR, ROAS, frequency, relevance scores. Most marketers open the dashboard, stare at the numbers, and still aren’t sure what to do next.
This is where large language models (LLMs) like Claude come in. Not to replace your judgment, but to do the interpretation work faster so you can act sooner.
Here is a practical breakdown of how to connect Claude to your Meta ad data and what you can actually do with it.
What the connection looks like
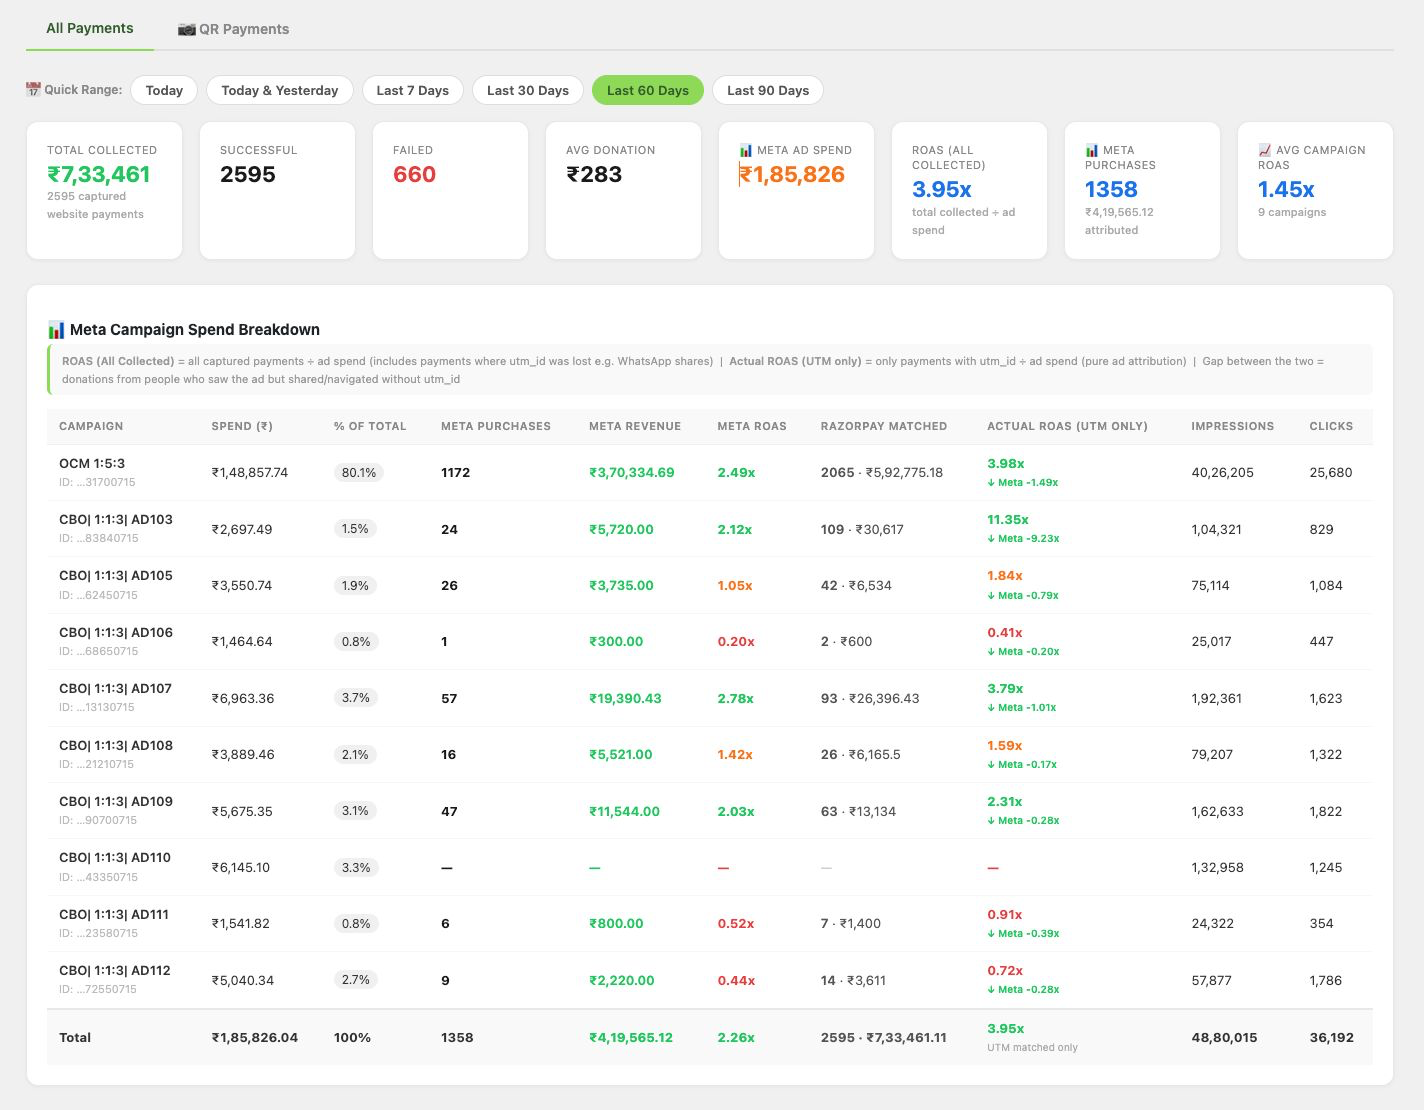
Claude does not have a native plug-in that reads your Meta Ads Manager directly. What it does have is the ability to read structured data you feed it. That data can come from three places:
1. Manual export Export your campaign data from Meta as a CSV. Paste it directly into Claude or upload the file. Ask Claude to analyse it. This is the simplest method and works immediately with no setup.
2. Google Sheets as a middle layer Connect Meta Ads to Google Sheets using a tool like Supermetrics, Porter Metrics, or the free Meta Ads connector in Looker Studio. Claude can then read a Google Sheet if you share the data with it in a session, or if you build a workflow using Claude’s API that pulls from Sheets automatically.
3. API to API (advanced) If you are comfortable with code or have a developer, you can pull data from the Meta Marketing API and pipe it into Claude’s API. This allows real-time querying: ask Claude a question about your campaigns and get a live answer. This is the setup used by teams building internal AI marketing dashboards.
What to actually ask Claude once you have the data

The value of connecting an LLM to ad data is not in reading numbers. It is in interpretation and next steps. Here are prompts that produce useful outputs:
Performance diagnosis
“Here is my Meta campaign data for the last 30 days. Which ad sets are underperforming relative to their spend? What is likely causing it?”
Budget reallocation
“Based on this data, if I cut the bottom 20% of spend and redistributed it, which campaigns would you prioritise and why?”
Creative fatigue detection
“Frequency is above 4 on three of my ad sets. Based on CTR trend over the period, which ones show signs of creative fatigue?”
Audience analysis
“I have two audiences running the same creative. Here is the breakdown by age, gender, placement and device. What does this tell me about who is actually converting?”
Reporting summaries
“Write a one-paragraph plain-English summary of this campaign performance for a client who does not understand advertising metrics.”
Where Claude adds the most value in a Meta workflow
Claude is not a media buyer. It will not negotiate CPMs or manage your bidding strategy. But it is exceptionally good at three things in a Meta context:
Pattern recognition across large exports A 90-day export with 40 ad sets and 200 creatives is hard to read manually. Claude processes it in seconds and surfaces what matters.
Writing ad copy variations at scale Feed Claude your top performing ad and ask it to generate 10 hook variations, each targeting a different pain point. This alone saves hours of copywriting time.
Building reporting frameworks Ask Claude to create a weekly performance review template based on your specific KPIs. It will output a structured document your team can fill in consistently every week.
A simple workflow you can start today

You do not need an API or a developer to get value from this immediately.
- Go to Meta Ads Manager. Set your date range to the last 30 days.
- Customise columns to include: spend, impressions, reach, frequency, CPM, CTR, CPC, results, cost per result, ROAS (if applicable).
- Export as CSV.
- Upload to Claude.
- Ask: “Analyse this Meta ad data. Identify the top 3 issues affecting performance and suggest specific actions for each.”
That is it. You will get a structured diagnosis in under a minute that would otherwise take 30 minutes of manual analysis.
The bigger picture
The marketers who will outperform over the next few years are not the ones who understand Meta Ads best in isolation. They are the ones who combine platform knowledge with AI fluency, using tools like Claude to compress the time between data and decision.
The dashboard will keep giving you numbers. The question is how fast you can turn those numbers into the next right move.

Free swipe file
100M SaaS Ads
Once Claude is reading your dashboard, feed it winning angles. Here are the ads worth learning from.
Get the swipe file